
Page 81 - Semiconductor For Micro- and Nanotechnology An Introduction For Engineers
P. 81
The Crystal Lattice System
ω ω M > m ω
m = 0.1M m = 0.1M m = 0.1M
k k k
ω ω ω
Dos Dos Dos
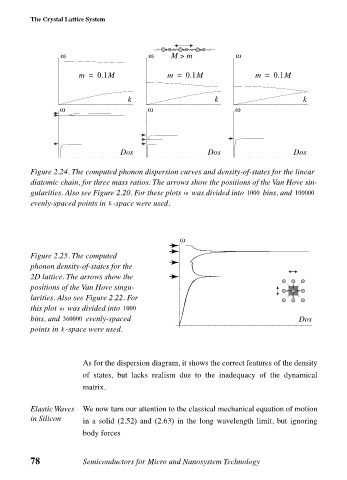
Figure 2.24. The computed phonon dispersion curves and density-of-states for the linear
diatomic chain, for three mass ratios. The arrows show the positions of the Van Hove sin-
ω
gularities. Also see Figure 2.20. For these plots was divided into 1000 bins, and 100000
evenly-spaced points in -space were used.
k
ω
Figure 2.25. The computed
phonon density-of-states for the
2D lattice. The arrows show the
positions of the Van Hove singu-
larities. Also see Figure 2.22. For
ω
this plot was divided into 1000
bins, and 360000 evenly-spaced Dos
points in -space were used.
k
As for the dispersion diagram, it shows the correct features of the density
of states, but lacks realism due to the inadequacy of the dynamical
matrix.
Elastic Waves We now turn our attention to the classical mechanical equation of motion
in Silicon in a solid (2.52) and (2.63) in the long wavelength limit, but ignoring
body forces
78 Semiconductors for Micro and Nanosystem Technology