
Page 245 - Sensors and Control Systems in Manufacturing
P. 245
Networking of Sensors and Contr ol Systems in Manufacturing
+2.5 205
(a)
3 SHARP
0
Acceleration (g) –2.5 (b) 2 SHARP
+2.5
1 FRACTURED
0.39 mm
0
–2.5
0 200
Time (ms)
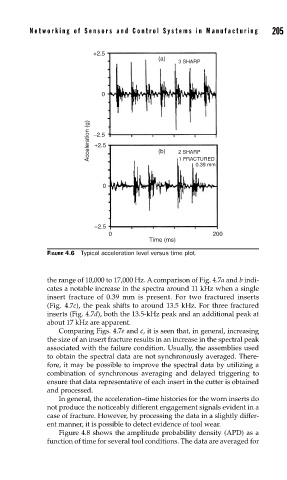
FIGURE 4.6 Typical acceleration level versus time plot.
the range of 10,000 to 17,000 Hz. A comparison of Fig. 4.7a and b indi-
cates a notable increase in the spectra around 11 kHz when a single
insert fracture of 0.39 mm is present. For two fractured inserts
(Fig. 4.7c), the peak shifts to around 13.5 kHz. For three fractured
inserts (Fig. 4.7d), both the 13.5-kHz peak and an additional peak at
about 17 kHz are apparent.
Comparing Figs. 4.7e and c, it is seen that, in general, increasing
the size of an insert fracture results in an increase in the spectral peak
associated with the failure condition. Usually, the assemblies used
to obtain the spectral data are not synchronously averaged. There-
fore, it may be possible to improve the spectral data by utilizing a
combination of synchronous averaging and delayed triggering to
ensure that data representative of each insert in the cutter is obtained
and processed.
In general, the acceleration–time histories for the worn inserts do
not produce the noticeably different engagement signals evident in a
case of fracture. However, by processing the data in a slightly differ-
ent manner, it is possible to detect evidence of tool wear.
Figure 4.8 shows the amplitude probability density (APD) as a
function of time for several tool conditions. The data are averaged for