
Page 599 - Sensors and Control Systems in Manufacturing
P. 599
552
Ele v e n
Cha p te r
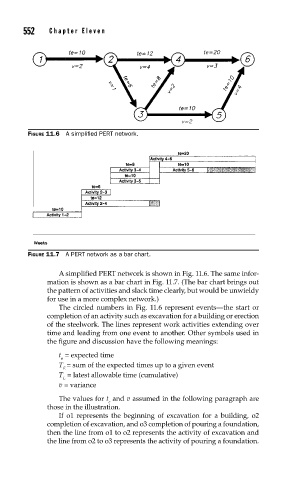
FIGURE 11.6 A simplifi ed PERT network.
FIGURE 11.7 A PERT network as a bar chart.
A simplified PERT network is shown in Fig. 11.6. The same infor-
mation is shown as a bar chart in Fig. 11.7. (The bar chart brings out
the pattern of activities and slack time clearly, but would be unwieldy
for use in a more complex network.)
The circled numbers in Fig. 11.6 represent events—the start or
completion of an activity such as excavation for a building or erection
of the steelwork. The lines represent work activities extending over
time and leading from one event to another. Other symbols used in
the figure and discussion have the following meanings:
t = expected time
e
T = sum of the expected times up to a given event
E
T = latest allowable time (cumulative)
L
v = variance
The values for t and v assumed in the following paragraph are
e
those in the illustration.
If o1 represents the beginning of excavation for a building, o2
completion of excavation, and o3 completion of pouring a foundation,
then the line from o1 to o2 represents the activity of excavation and
the line from o2 to o3 represents the activity of pouring a foundation.