
Page 159 - Separation process engineering
P. 159
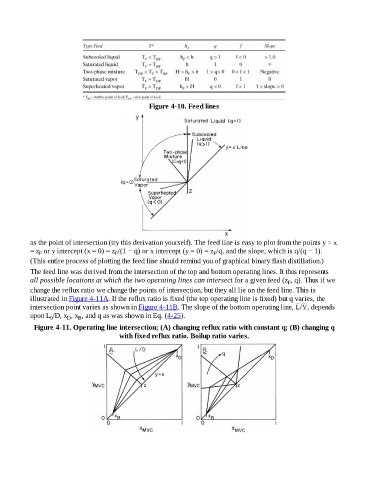
Figure 4-10. Feed lines


                    as the point of intersection (try this derivation yourself). The feed line is easy to plot from the points y = x
                    = z  or y intercept (x = 0) = z /(1 − q) or x intercept (y = 0) = z /q, and the slope, which is q/(q − 1).
                       F
                                                     F
                                                                                            F
                    (This entire process of plotting the feed line should remind you of graphical binary flash distillation.)
                    The feed line was derived from the intersection of the top and bottom operating lines. It thus represents
                    all possible locations at which the two operating lines can intersect for a given feed (z , q). Thus if we
                                                                                                                         F
                    change the reflux ratio we change the points of intersection, but they all lie on the feed line. This is
                    illustrated in Figure 4-11A. If the reflux ratio is fixed (the top operating line is fixed) but q varies, the
                    intersection point varies as shown in Figure 4-11B. The slope of the bottom operating line,  / , depends
                    upon L /D, x , x , and q as was shown in Eq. (4-25).
                            0
                                       B
                                  D
                      Figure 4-11. Operating line intersection; (A) changing reflux ratio with constant q; (B) changing q
                                                       with fixed reflux ratio. Boilup ratio varies.