
Page 73 - Separation process engineering
P. 73
2/3, what are the liquid and vapor compositions? (d) Repeat step c, given that F is specified as 1000
kmol/h.
Solution
A. Define. We wish to analyze the performance of a flash separator at 1 atm.
a. Find y max .
b. Find x min .
c. and d. Find y and x for V/F = 2/3.
B. Explore. Note that p drum = 101.3 kPa = 1 atm. Thus we must use data at this pressure. These data
are conveniently available in Table 2-1 and Figure 2-2. Since p drum and V/F for part c are given, a
sequential solution procedure will be used. For parts a and b we will look at limiting values of
V/F.
C. Plan. We will use the y-x diagram as illustrated in Figure 2-2. For all cases we will do a mass
balance to derive an operating line [we could use Eqs. (2-11), (2-13), or (2-15), but I wish to
illustrate deriving an operating line]. Note that 0 ≤ V/F ≤ 1.0. Thus our maximum and minimum
values for V/F must lie within this range.
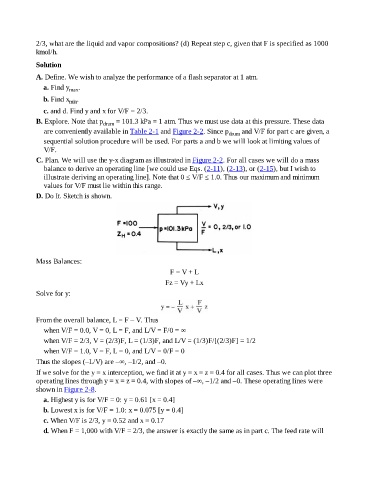
D. Do It. Sketch is shown.
Mass Balances:
F = V + L
Fz = Vy + Lx
Solve for y:
From the overall balance, L = F – V. Thus
when V/F = 0.0, V = 0, L = F, and L/V = F/0 = ∞
when V/F = 2/3, V = (2/3)F, L = (1/3)F, and L/V = (1/3)F/[(2/3)F] = 1/2
when V/F = 1.0, V = F, L = 0, and L/V = 0/F = 0
Thus the slopes (–L/V) are –∞, –1/2, and –0.
If we solve for the y = x interception, we find it at y = x = z = 0.4 for all cases. Thus we can plot three
operating lines through y = x = z = 0.4, with slopes of –∞, –1/2 and –0. These operating lines were
shown in Figure 2-8.
a. Highest y is for V/F = 0: y = 0.61 [x = 0.4]
b. Lowest x is for V/F = 1.0: x = 0.075 [y = 0.4]
c. When V/F is 2/3, y = 0.52 and x = 0.17
d. When F = 1,000 with V/F = 2/3, the answer is exactly the same as in part c. The feed rate will