
Page 71 - Separation process engineering
P. 71
(2-14)
and the operating equation becomes
(2-15)
Although they have different forms Eqs. (2-11), (2-13), and (2-15) are equivalent means of obtaining y, x,
or z. We will use whichever operating equation is most convenient.
Now the equilibrium and the operating equation (Eq. 2-11, 2-13, or 2-15) must be solved simultaneously.
The exact way to do this depends on the form of the equilibrium data. For binary systems a graphical
solution is very convenient. Equations (2-11), (2-13), and (2-15) represent a single straight line, called
the operating line, on a graph of y vs. x. This straight line will have
(2-16)
and
(2-17)
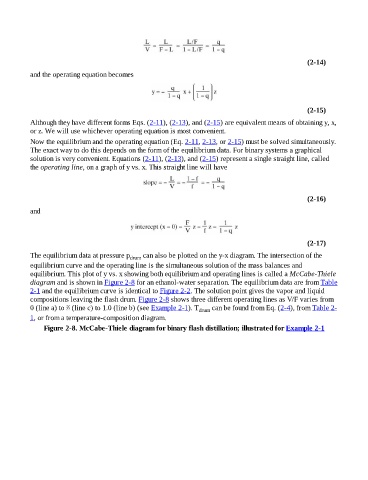
The equilibrium data at pressure p drum can also be plotted on the y-x diagram. The intersection of the
equilibrium curve and the operating line is the simultaneous solution of the mass balances and
equilibrium. This plot of y vs. x showing both equilibrium and operating lines is called a McCabe-Thiele
diagram and is shown in Figure 2-8 for an ethanol-water separation. The equilibrium data are from Table
2-1 and the equilibrium curve is identical to Figure 2-2. The solution point gives the vapor and liquid
compositions leaving the flash drum. Figure 2-8 shows three different operating lines as V/F varies from
0 (line a) to (line c) to 1.0 (line b) (see Example 2-1). T drum can be found from Eq. (2-4), from Table 2-
1, or from a temperature-composition diagram.
Figure 2-8. McCabe-Thiele diagram for binary flash distillation; illustrated for Example 2-1