
Page 67 - Separation process engineering
P. 67
in equilibrium must be at the same temperature, these points are connected by an isotherm. Points between
the saturated vapor and liquid curves represent two-phase systems. An isotherm through any point can be
generated using the auxiliary line with the construction shown in Figure 2-5. To find an isotherm, go
vertically from the saturated liquid curve to the auxiliary line. Then go horizontally to the saturated vapor
line. The line connecting the points on the saturated vapor and saturated liquid curves is the isotherm. If
an isotherm is desired through a point in the two-phase region, a simple trial-and-error procedure is
required.
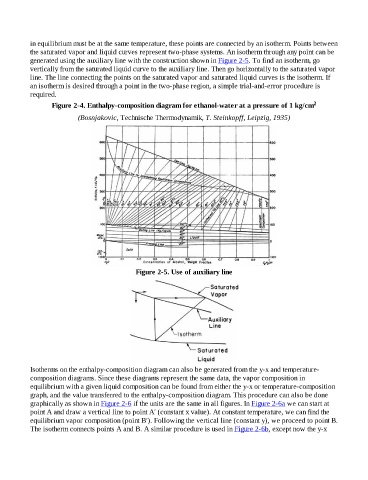
Figure 2-4. Enthalpy-composition diagram for ethanol-water at a pressure of 1 kg/cm 2
(Bosnjakovic, Technische Thermodynamik, T. Steinkopff, Leipzig, 1935)
Figure 2-5. Use of auxiliary line
Isotherms on the enthalpy-composition diagram can also be generated from the y-x and temperature-
composition diagrams. Since these diagrams represent the same data, the vapor composition in
equilibrium with a given liquid composition can be found from either the y-x or temperature-composition
graph, and the value transferred to the enthalpy-composition diagram. This procedure can also be done
graphically as shown in Figure 2-6 if the units are the same in all figures. In Figure 2-6a we can start at
point A and draw a vertical line to point A′ (constant x value). At constant temperature, we can find the
equilibrium vapor composition (point B′). Following the vertical line (constant y), we proceed to point B.
The isotherm connects points A and B. A similar procedure is used in Figure 2-6b, except now the y-x