
Page 66 - Separation process engineering
P. 66
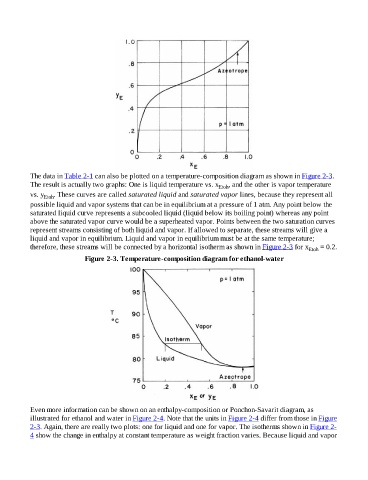
The data in Table 2-1 can also be plotted on a temperature-composition diagram as shown in Figure 2-3.
                    The result is actually two graphs: One is liquid temperature vs. x        Etoh , and the other is vapor temperature

                    vs. y Etoh . These curves are called saturated liquid and saturated vapor lines, because they represent all
                    possible liquid and vapor systems that can be in equilibrium at a pressure of 1 atm. Any point below the
                    saturated liquid curve represents a subcooled liquid (liquid below its boiling point) whereas any point
                    above the saturated vapor curve would be a superheated vapor. Points between the two saturation curves
                    represent streams consisting of both liquid and vapor. If allowed to separate, these streams will give a
                    liquid and vapor in equilibrium. Liquid and vapor in equilibrium must be at the same temperature;

                    therefore, these streams will be connected by a horizontal isotherm as shown in Figure 2-3 for x             Etoh  = 0.2.
                                         Figure 2-3. Temperature-composition diagram for ethanol-water


                    Even more information can be shown on an enthalpy-composition or Ponchon-Savarit diagram, as
                    illustrated for ethanol and water in Figure 2-4. Note that the units in Figure 2-4 differ from those in Figure
                    2-3. Again, there are really two plots: one for liquid and one for vapor. The isotherms shown in Figure 2-
                    4 show the change in enthalpy at constant temperature as weight fraction varies. Because liquid and vapor