
Page 100 - Separation process principles 2
P. 100
Exercises 65
Vapor pressure is given by (2-39), where constants for benzene are XI In Yl In Y2
in Exercise 2.12 and constants for cyclohexane are kl = 15.7527,
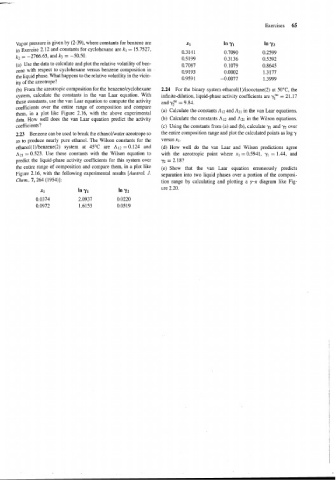
0.3141 0.7090 0.2599
kz = -2766.63, and k3 = -50.50.
0.5199 0.3136 0.5392
(a) Use the data to calculate and plot the relative volatility of ben- 0.7087 0.1079 0.8645
zene with respect to cyclohexane versus benzene composition in 0.9193 0.0002 1.3177
the liquid phase. What happens to the relative volatility in the vicin- 0.959 1 -0.0077 1.3999
it^ of the azeotrope?
(b) From the azeotropic composition for the benzenelcyclohexane 2.24 For the binary system ethanol(l)/isooctane(2) at 50°C, the
system, calculate the constants in the van Laar equation. With infinite-dilution, liquid-phase activity coefficients are y? = 2 1.17
these constants, use the van Laar equation to compute the activity and y,OO = 9.84.
coefficients over the entire range of composition and compare
them, in a plot like Figure 2.16, with the above experimental (a) Calculate the constants AIZ and AZ1 in the van Laar equations.
data. How well does the van Laar equation predict the activity (b) Calculate the constants AI2 and A2, in the Wilson equations.
coefficients? (c) Using the constants from (a) and (b), calculate yl and y2 over
2.23 Benzene can be used to break the ethanollwater azeotrope so the entire composition range and plot the calculated points as log y
as to produce nearly pure ethanol. The Wilson constants for the versus XI.
ethanol(l)/benzene(2) system at 45°C are A12 = 0.124 and (d) How well do the van Laar and Wilson predictions agree
A,, = 0.523. Use these constants with the Wilson equation to with the azeotropic point where xl =0.5941, yl = 1.44, and
predict the liquid-phase activity coefficients for this system over = 2.18?
the entire range of composition and compare them, in a plot like (e) Show that the van Laar equation erroneously predicts
Figure 2.16, with the following experimental results [Austral. J.
separation into two liquid phases over a portion of the composi-
Chem., 7,264 (1954)l:
tion range by calculating and plotting a y-x diagram like Fig-
ure 2.20.