
Page 53 - Separation process principles 2
P. 53
18 Chapter 1 Separation Processes
i
!
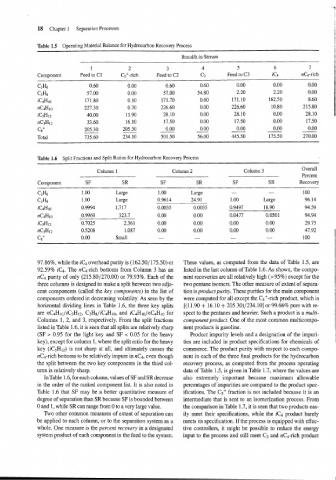
Table 1.5 Operating Material Balance for Hydrocarbon Recovery Process
lbmolh in Stream
1 2 3 4 5 6 7
Component Feed to C 1 C5+-rich Feed to C2 c3 Feed to C3 iC4 nC4-rich
c6+
Total
Table 1.6 Split Fractions and Split Ratios for Hydrocarbon Recovery Process
Column 1 Column 2 Column 3 Overall
Percent
Component SF SR SF SR SF SR Recovery
C2H6 1 .OO Large 1 .OO Large - - 100
C3Hs 1 .OO Large 0.9614 24.91 1 .OO Large 96.14
iC4H1o 0.9994 1,717 0.0035 0.0035 0.9497 18.90 94.59
nC4H1o 0.9969 323.7 0.00 0.00 0.0477 0.0501 94.94
iC5H12 0.7025 2.361 0.00 0.00 0.00 0.00 29.75
C6+ 0.00 Small - - - - 100
97.86%, while the iC4 overhead purity is (162.50/175.50) or These values, as computed from the data of Table 1.5, are
92.59% iC4. The nC4-rich bottoms from Column 3 has an listed in the last column of Table I .6. As shown, the compo-
nC4 purity of only (215.80/270.00) or 79.93%. Each of the nent recoveries are all relatively high (>95%) except for the
three columns is designed to make a split between two adja- two pentane isomers. The other measure of extent of separa-
cent components (called the key components) in the list of tion is productpurity. These purities for the main component
components ordered in decreasing volatility. As seen by the were computed for all except the C5+-rich product, which is
horizontal dividing lines in Table 1.6, the three key splits [(11.90 + 16.10 + 205.30)/234.10] or 99.66% pure with re-
are nC4Hlo/iCsH12, C3Hs/iC4Hl0, and iC4Hlo/nC4Hlo for spect to the pentanes and heavier. Such a product is a multi-
Columns 1, 2, and 3, respectively. From the split fractions component product. One of the most common multicompo-
listed in Table 1.6, it is seen that all splits are relatively sharp nent products is gasoline.
(SF > 0.95 for the light key and SF < 0.05 for the heavy Product impurity levels and a designation of the impuri-
key), except for column 1, where the split ratio for the heavy ties are included in product specifications for chemicals of
key (iC5HI2) is not sharp at all, and ultimately causes the commerce. The product purity with respect to each compo-
nC4-rich bottoms to be relatively impure in nC4, even though nent in each of the three final products for the hydrocarbon
the split between the two key components in the third col- recovery process, as computed from the process operating
umn is relatively sharp. data of Table 1.5, is given in Table 1.7, where the values are
InTable 1.6, for each column, values of SF and SR decrease also extremely important because maximum allowable
in the order of the ranked component list. It is also noted in percentages of impurities are compared to the product spec-
Table 1.6 that SF may be a better quantitative measure of ifications. The C5+ fraction is not included because it is an
degree of separation than SR because SF is bounded between internlediate that is sent to an isomerization process. From
0 and 1, while SR can range from 0 to a very large value. the comparison in Table 1.7, it is seen that two products eas-
Two other common measures of extent of separation can ily meet their specifications, while the iC4 product barely
be applied to each column, or to the separation system as a meets its specification. If the process is equipped with effec-
whole. One measure is the percent recovery in a designated tive controllers, it might be possible to reduce the energy
system product of each component in the feed to the system. input to the process and still meet C3 and nC4-rich product