
Page 54 - Separation process principles 2
P. 54
1.8 Separation Power 19
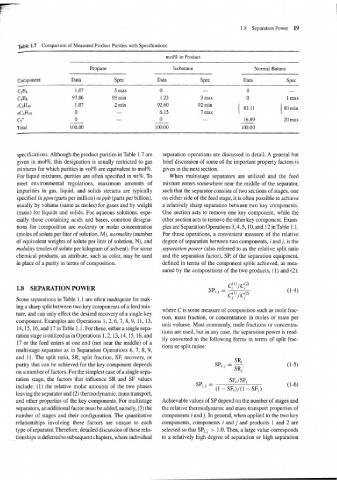
Table 1.7 comparison of Measured Product Purities with Specifications
mol% in Product
Propane Isobutane Normal Butane
Component Data Spec Data Spec Data Spec
1.07 5 rnax 0
C3Hs 97.86 93 min 1.25 3 rnax 0 l max
2 rnin 92 rnin
{ 80 rnin
- 7 rnax
Csf 0 - 0 - 16.89 20 rnax
Total 100.00 100.00 100.00
specifications. Although the product purities in Table 1.7 are separation operations are discussed in detail. A general but
given in mol%, this designation is usually restricted to gas brief discussion of some of the important property factors is
mixtures for which purities in vol% are equivalent to mol%. given in the next section.
For liquid mixtures, purities are often specified in wt%. To When multistage separators are utilized and the feed
meet environmental regulations, maximum amounts of mixture enters somewhere near the middle of the separator,
impurities in gas, liquid, and solids streams are typically such that the separator consists of two sections of stages, one
specified in ppm (parts per million) orppb (parts per billion), on either side of the feed stage, it is often possible to achieve
usually by volume (same as moles) for gases and by weight a relatively sharp separation between two key components.
(mass) for liquids and solids. For aqueous solutions, espe- One section acts to remove one key component, while the
cially those containing acids and bases, common designa- other section acts to remove the other key component. Exam-
tions for composition are molarity or molar concentration ples are Separation Operations 3,4,5,10, and 12 in Table 1.1.
(moles of solute per liter of solution, M), normality (number For these operations, a convenient measure of the relative
of equivalent weights of solute per liter of solution, N), and degree of separation between two components, i and j, is the
molality (moles of solute per kilogram of solvent). For some separation power (also referred to as the relative split ratio
chemical products, an attribute, such as color, may be used and the separation factor), SP, of the separation equipment,
in place of a purity in terms of composition. defined in terms of the component splits achieved, as mea-
sured by the compositions of the two products, (1) and (2):
1.8 SEPARATION POWER
Some separations in Table 1.1 are often inadequate for mak-
ing a sharp split between two key components of a feed mix-
where C is some measure of composition such as mole frac-
ture, and can only effect the desired recovery of a single key
tion, mass fraction, or concentration in moles or mass per
component. Examples are Operations 1,2,6,7, 8,9, 11, 13,
unit volume. Most commonly, mole fractions or concentra-
14, 15, 16, and 17 in Table 1.1. For these, either a single sepa-
tions are used, but in any case, the separation power is read-
ration stage is utilized as in Operations l, 2,13,14,15,16, and
ily converted to the following forms in terms of split frac-
17 or the feed enters at one end (not near the middle) of a
tions or split ratios:
multistage separator as in Separation Operations 6, 7, 8, 9,
and 11. The split ratio, SR, split fraction, SF, recovery, or
purity that can be achieved for the key component depends
on a number of factors. For the simplest case of a single sepa-
ration stage, the factors that influence SR and SF values SFi /SFj
include: (1) the relative molar amounts of the two phases SP. . -
''I - (1 - SFi)/(l - SF,)
leaving the separator and (2) thermodynamic, mass transport,
and other properties of the key components. For multistage Achievable values of SP depend on the number of stages and
separators, an additional factor must be added, namely, (3) the the relative thermodynamic and mass transport properties of
number of stages and their configuration. The quantitative components i and j. In general, when applied to the two key
relationships involving these factors are unique to each components, components i and j and products 1 and 2 are
type of separator. Therefore, detailed discussion of these rela- selected so that SP,,, > 1.0. Then, a large value corresponds
tionships is deferred to subsequent chapters, where individual to a relatively high degree of separation or high separation