
Page 111 -
P. 111
6 What Software Engineering Has to Offer to Agent-Based Social Simulation 107
“working with computer”). It is important to consider only key locations and key
activities as otherwise the state chart gets too complex. One should only define as
much detail as is really necessary for investigating the question studied. The above
steps are just suggestions and do not always work. In case they do not work, one has
to use intuition and try to draft something that “feels right”.
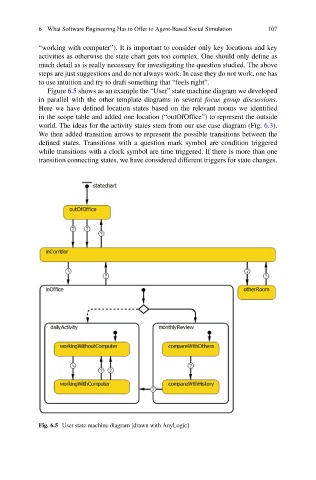
Figure 6.5 shows as an example the “User” state machine diagram we developed
in parallel with the other template diagrams in several focus group discussions.
Here we have defined location states based on the relevant rooms we identified
in the scope table and added one location (“outOfOffice”) to represent the outside
world. The ideas for the activity states stem from our use case diagram (Fig. 6.3).
We then added transition arrows to represent the possible transitions between the
defined states. Transitions with a question mark symbol are condition triggered
while transitions with a clock symbol are time triggered. If there is more than one
transition connecting states, we have considered different triggers for state changes.
Fig. 6.5 User state machine diagram [drawn with AnyLogic]