
Page 177 - Six Sigma Demystified
P. 177
158 Six SigMa DemystifieD
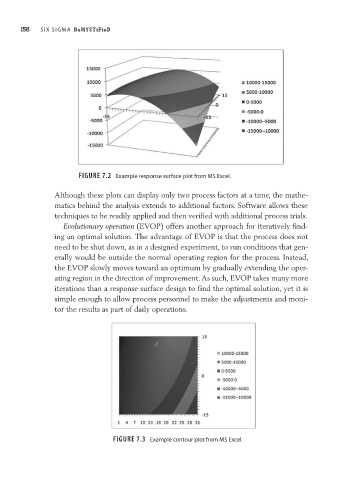
FiguRe 7.2 Example response surface plot from MS Excel.
Although these plots can display only two process factors at a time, the mathe-
matics behind the analysis extends to additional factors. Software allows these
techniques to be readily applied and then verified with additional process trials.
Evolutionary operation (EVOP) offers another approach for iteratively find-
ing an optimal solution. The advantage of EVOP is that the process does not
need to be shut down, as in a designed experiment, to run conditions that gen-
erally would be outside the normal operating region for the process. Instead,
the EVOP slowly moves toward an optimum by gradually extending the oper-
ating region in the direction of improvement. As such, EVOP takes many more
iterations than a response surface design to find the optimal solution, yet it is
simple enough to allow process personnel to make the adjustments and moni-
tor the results as part of daily operations.
FiguRe 7.3 Example contour plot from MS Excel.