
Page 172 - Six Sigma Demystified
P. 172
Chapter 7 i m p r o v e S tag e 153
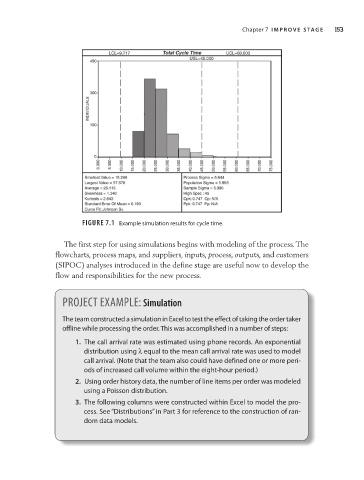
FiguRe 7.1 Example simulation results for cycle time.
The first step for using simulations begins with modeling of the process. The
flowcharts, process maps, and suppliers, inputs, process, outputs, and customers
(SIPOC) analyses introduced in the define stage are useful now to develop the
flow and responsibilities for the new process.
PRoject examPle: Simulation
The team constructed a simulation in Excel to test the effect of taking the order taker
offline while processing the order. This was accomplished in a number of steps:
1. The call arrival rate was estimated using phone records. an exponential
distribution using l equal to the mean call arrival rate was used to model
call arrival. (Note that the team also could have defined one or more peri-
ods of increased call volume within the eight- hour period.)
2. Using order history data, the number of line items per order was modeled
using a Poisson distribution.
3. The following columns were constructed within Excel to model the pro-
cess. See “Distributions” in Part 3 for reference to the construction of ran-
dom data models.