
Page 226 - Six Sigma Demystified
P. 226
206 Six SigMa DemystifieD
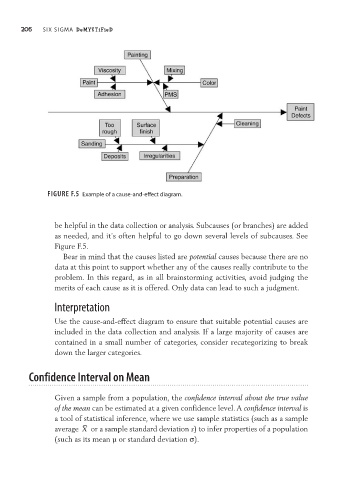
Figure F.5 Example of a cause-and-effect diagram.
be helpful in the data collection or analysis. Subcauses (or branches) are added
as needed, and it’s often helpful to go down several levels of subcauses. See
Figure F.5.
Bear in mind that the causes listed are potential causes because there are no
data at this point to support whether any of the causes really contribute to the
problem. In this regard, as in all brainstorming activities, avoid judging the
merits of each cause as it is offered. Only data can lead to such a judgment.
Interpretation
Use the cause-and-effect diagram to ensure that suitable potential causes are
included in the data collection and analysis. If a large majority of causes are
contained in a small number of categories, consider recategorizing to break
down the larger categories.
Confidence interval on mean
Given a sample from a population, the confidence interval about the true value
of the mean can be estimated at a given confidence level. A confidence interval is
a tool of statistical inference, where we use sample statistics (such as a sample
average X or a sample standard deviation s) to infer properties of a population
(such as its mean µ or standard deviation σ).