
Page 223 - Six Sigma Demystified
P. 223
Part 3 s i x s i g m a to o l s 203
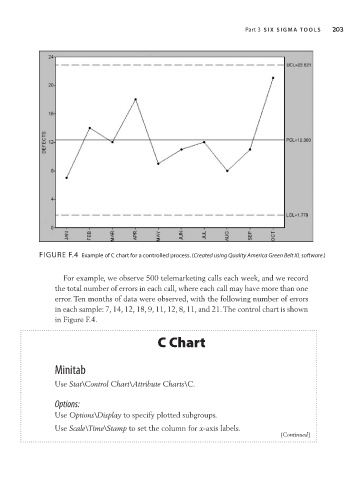
FiguRE F.4 Example of C chart for a controlled process. (Created using Quality America Green Belt XL software.)
For example, we observe 500 telemarketing calls each week, and we record
the total number of errors in each call, where each call may have more than one
error. Ten months of data were observed, with the following number of errors
in each sample: 7, 14, 12, 18, 9, 11, 12, 8, 11, and 21. The control chart is shown
in Figure F.4.
C Chart
Minitab
Use Stat\Control Chart\Attribute Charts\C.
Options:
Use Options\Display to specify plotted subgroups.
Use Scale\Time\Stamp to set the column for x-axis labels.
(Continued)