
Page 220 - Six Sigma Demystified
P. 220
200 Six SigMa DemystifieD
When to Use
In any application, box-whisker charts are not control charts because they do
not have statistical control limits. For this reason, they may not be used to es-
tablish statistical control of a process or to baseline a process.
Analyze Stage
• To graphically compare the location and variation of various processes or
categories of products or services
Improve Stage
• To graphically compare before and after states of process improvement
Methodology
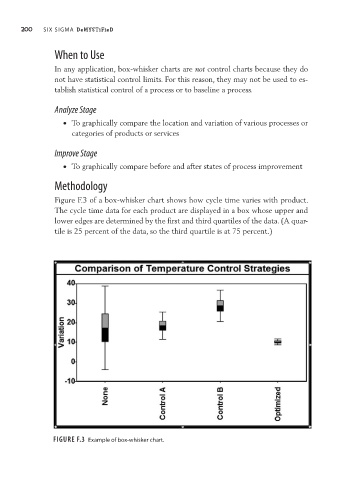
Figure F.3 of a box-whisker chart shows how cycle time varies with product.
The cycle time data for each product are displayed in a box whose upper and
lower edges are determined by the first and third quartiles of the data. (A quar-
tile is 25 percent of the data, so the third quartile is at 75 percent.)
Figure F.3 Example of box-whisker chart.