
Page 218 - Six Sigma Demystified
P. 218
198 Six SigMa DemystifieD
Interpretation
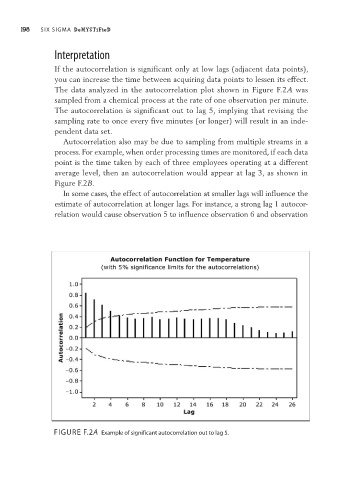
If the autocorrelation is significant only at low lags (adjacent data points),
you can increase the time between acquiring data points to lessen its effect.
The data analyzed in the autocorrelation plot shown in Figure F.2A was
sampled from a chemical process at the rate of one observation per minute.
The autocorrelation is significant out to lag 5, implying that revising the
sampling rate to once every five minutes (or longer) will result in an inde-
pendent data set.
Autocorrelation also may be due to sampling from multiple streams in a
process. For example, when order processing times are monitored, if each data
point is the time taken by each of three employees operating at a different
average level, then an autocorrelation would appear at lag 3, as shown in
Figure F.2B.
In some cases, the effect of autocorrelation at smaller lags will influence the
estimate of autocorrelation at longer lags. For instance, a strong lag 1 autocor-
relation would cause observation 5 to influence observation 6 and observation
FiguRE F.2A Example of significant autocorrelation out to lag 5.