Page 214 - Six Sigma Demystified
P. 214

194        Six SigMa  DemystifieD


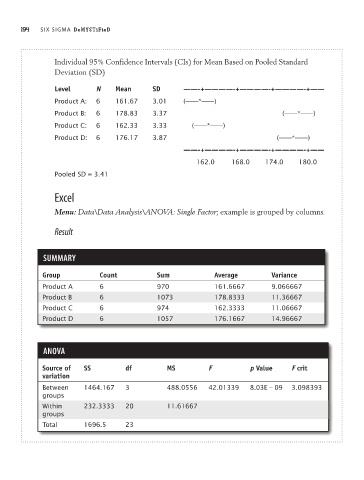
                        Individual 95% Confidence Intervals (CIs) for Mean Based on Pooled Standard
                        Deviation (SD)

                        Level      N     Mean      SD       ——-+————-+————-+————-+——
                        Product A:   6   161.67    3.01     (——*——)
                        Product B:   6   178.83    3.37                                   (——*——)
                        Product C:   6   162.33    3.33       (——*——)

                        Product D:   6   176.17    3.87                                                      (——*——)
                                                            ——-+————-+————-+————-+——
                                                               162.0     168.0     174.0    180.0
                        Pooled SD = 3.41

                        Excel

                        Menu: Data\Data Analysis\ANOVA: Single Factor; example is grouped by columns.


                        Result


                     SummAry

                    Group           Count           Sum             Average         Variance

                    Product A       6               970             161.6667        9.066667
                    Product B       6               1073            178.8333        11.36667
                    Product C       6               974             162.3333        11.06667

                    Product D       6               1057            176.1667        14.96667


                     ANOVA

                    Source of   SS          df         MS          F          p Value     F crit
                    variation
                    Between     1464.167    3          488.0556    42.01339   8.03E – 09  3.098393
                    groups
                    Within      232.3333    20         11.61667
                    groups
                    Total       1696.5      23
   209   210   211   212   213   214   215   216   217   218   219