
Page 219 - Six Sigma Demystified
P. 219
Part 3 s i x s i g m a to o l s 199
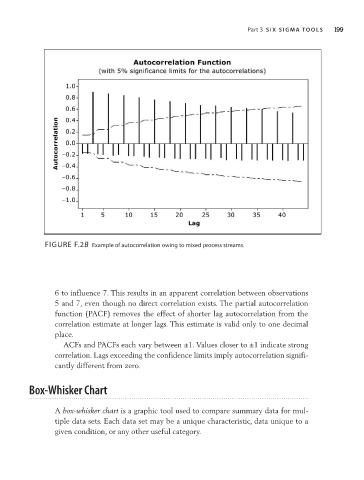
FiguRE F.2B Example of autocorrelation owing to mixed process streams.
6 to influence 7. This results in an apparent correlation between observations
5 and 7, even though no direct correlation exists. The partial autocorrelation
function (PACF) removes the effect of shorter lag autocorrelation from the
correlation estimate at longer lags. This estimate is valid only to one decimal
place.
ACFs and PACFs each vary between ±1. Values closer to ±1 indicate strong
correlation. Lags exceeding the confidence limits imply autocorrelation signifi-
cantly different from zero.
box-Whisker Chart
A box-whisker chart is a graphic tool used to compare summary data for mul-
tiple data sets. Each data set may be a unique characteristic, data unique to a
given condition, or any other useful category.