
Page 213 - Six Sigma Demystified
P. 213
Part 3 s i x s i g m a to o l s 193
When used to test for differences in the averages between subsets of data (or
treatments), the null hypothesis tested by ANOVA (for a fixed-effects model)
is that all the subset averages are equal. The F statistic is used to compare the
mean square treatment (the average between-subset variation) with the mean
square error (the sum of squares of the residuals). The assumptions in the test
are that the distribution for each subset is normal and that the subsets have
equal variance (although their means may be different). The null hypothesis
that the subsets are equal is rejected when the p value for the F test is less than
0.05, implying that at least one of the subset averages is different.
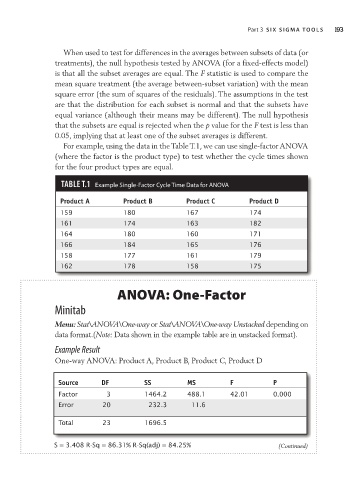
For example, using the data in the Table T.1, we can use single-factor ANOVA
(where the factor is the product type) to test whether the cycle times shown
for the four product types are equal.
TAble T.1 Example Single-Factor Cycle Time Data for aNOVa
Product A Product B Product C Product D
159 180 167 174
161 174 163 182
164 180 160 171
166 184 165 176
158 177 161 179
162 178 158 175
ANOVA: One-Factor
Minitab
Menu: Stat\ANOVA\One-way or Stat\ANOVA\One-way Unstacked depending on
data format.(Note: Data shown in the example table are in unstacked format).
Example Result
One-way ANOVA: Product A, Product B, Product C, Product D
Source DF SS MS F P
Factor 3 1464.2 488.1 42.01 0.000
Error 20 232.3 11.6
Total 23 1696.5
S = 3.408 R-Sq = 86.31% R-Sq(adj) = 84.25% (Continued)