Page 229 - Six Sigma Demystified
P. 229

Part 3  s i x   s i g m a  to o l s        209


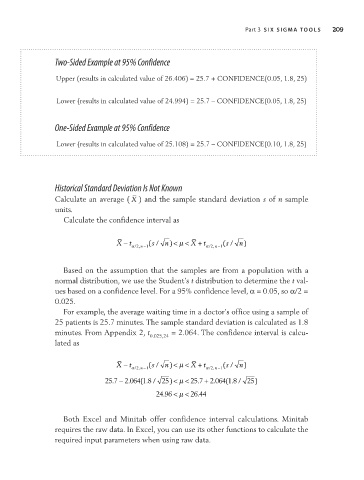
                           Two-Sided Example at 95% Confidence

                           Upper (results in calculated value of 26.406) = 25.7 + CONFIDENCE(0.05, 1.8, 25)


                           Lower (results in calculated value of 24.994) = 25.7 – CONFIDENCE(0.05, 1.8, 25)


                           One-Sided Example at 95% Confidence


                           Lower (results in calculated value of 25.108) = 25.7 – CONFIDENCE(0.10, 1.8, 25)


                           Historical Standard Deviation Is Not Known
                           Calculate an average ( X ) and the sample standard deviation s of n sample
                           units.
                             Calculate the confidence interval as


                                            X − t α / , n −1  s ( /  n < µ <  X +  t α / , n −1  s ( /  n)
                                                           )
                                                                      2
                                                  2
                             Based on the assumption that the samples are from a population with a
                           normal distribution, we use the Student’s t distribution to determine the t val-
                           ues based on a confidence level. For a 95% confidence level, α = 0.05, so α/2 =
                           0.025.
                             For example, the average waiting time in a doctor’s office using a sample of

                           25 patients is 25.7 minutes. The sample standard deviation is calculated as 1.8
                           minutes. From Appendix 2, t 0.025,24  = 2.064. The confidence interval is calcu-
                           lated as


                                            X − t α / ,  n −1  s ( /  n < µ <  X +  t α / ,  n −1  s ( /  n)
                                                           )
                                                                      2
                                                  2
                                                                             8
                                                                           1
                                                           )
                                                   ( .8
                                         25 .7 − . 2 064 1 / 25 < µ <  25 .7 +  . 2 064 ( . / 25 )
                                                      /
                                                       24 .96 < µ <  26 .44
                             Both  Excel  and  Minitab  offer  confidence  interval  calculations.  Minitab
                           requires the raw data. In Excel, you can use its other functions to calculate the
                           required input parameters when using raw data.
   224   225   226   227   228   229   230   231   232   233   234