
Page 232 - Six Sigma Demystified
P. 232
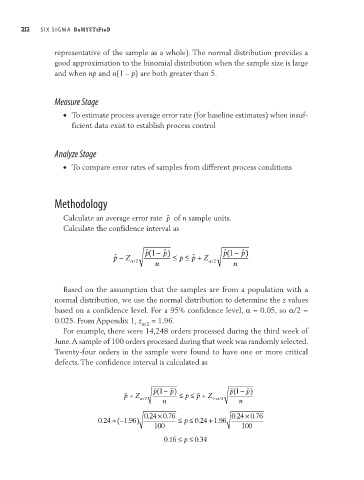
212        Six SigMa  DemystifieD


                        representative of the sample as a whole). The normal distribution provides a
                        good approximation to the binomial distribution when the sample size is large
                        and when np and n(1 – p) are both greater than 5.


                        Measure Stage
                          •	 To estimate process average error rate (for baseline estimates) when insuf-
                             ficient data exist to establish process control


                        Analyze Stage

                          •	 To compare error rates of samples from different process conditions


                        Methodology

                          Calculate an average error rate  ˆ p  of n sample units.
                          Calculate the confidence interval as


                                                   1
                                                                         1
                                                 ˆ ( p −  ˆ ) p        ˆ ( p −  ˆ ) p
                                         ˆ p −  Z α /2  n  ≤  p ≤  ˆ p +  Z α /2  n


                          Based on the assumption that the samples are from a population with a
                        normal distribution, we use the normal distribution to determine the z values
                        based on a confidence level. For a 95% confidence level, α = 0.05, so α/2 =
                        0.025. From Appendix 1, z    α/2  = 1.96.
                          For example, there were 14,248 orders processed during the third week of
                        June. A sample of 100 orders processed during that week was randomly selected.
                        Twenty-four orders in the sample were found to have one or more critical
                        defects. The confidence interval is calculated as


                                                   p(1 −  p)             p(1 −  p)
                                           p +  Z          ≤  p ≤  p +  Z
                                                      n             1 −α /2  n
                                                α /2
                                                                          .
                                                     × .
                                                  . 0 24 × 0 76          0 24 × 0 76.
                                     . 0 24  + − ( 1 .96 )  ≤ p  ≤ 0 24 1 96.  + .
                                                    100                     100
                                                      0 16  ≤ p  ≤ 0 34.
                                                       .