Page 236 - Six Sigma Demystified
P. 236

216        Six SigMa  DemystifieD


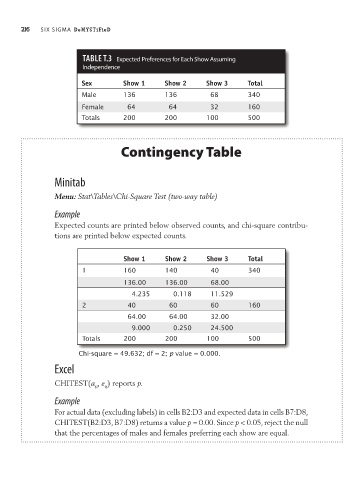
                                TAble T.3  Expected Preferences for Each Show assuming
                                independence

                               Sex           Show 1      Show 2     Show 3    Total
                               Male        136         136         68         340
                               Female       64          64         32         160
                               Totals      200         200        100         500


                                          Contingency Table


                        Minitab

                        Menu: Stat\Tables\Chi-Square Test (two-way table)

                        Example
                        Expected counts are printed below observed counts, and chi-square contribu-
                        tions are printed below expected counts.


                                             Show 1      Show 2     Show 3    Total
                               1           160         140         40         340
                                           136.00      136.00      68.00
                                             4.235       0.118     11.529
                               2            40          60         60         160
                                            64.00       64.00      32.00

                                             9.000       0.250     24.500
                               Totals      200         200        100         500
                               Chi-square = 49.632; df = 2; p value = 0.000.
                        Excel

                        CHITEST(a , e ) reports p.
                                   ii
                                      ii
                        Example
                        For actual data (excluding labels) in cells B2:D3 and expected data in cells B7:D8,
                        CHITEST(B2:D3, B7:D8) returns a value p = 0.00. Since p < 0.05, reject the null
                        that the percentages of males and females preferring each show are equal.
   231   232   233   234   235   236   237   238   239   240   241