
Page 241 - Six Sigma Demystified
P. 241
Part 3 s i x s i g m a to o l s 221
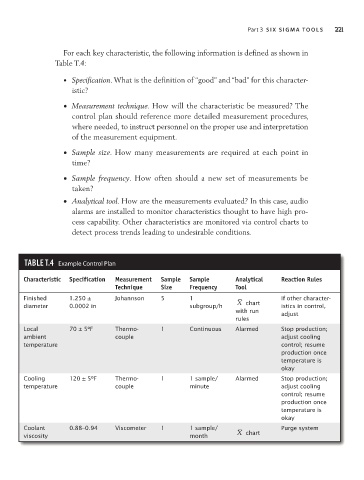
For each key characteristic, the following information is defined as shown in
Table T.4:
• Specification. What is the definition of “good” and “bad” for this character-
istic?
• Measurement technique. How will the characteristic be measured? The
control plan should reference more detailed measurement procedures,
where needed, to instruct personnel on the proper use and interpretation
of the measurement equipment.
• Sample size. How many measurements are required at each point in
time?
• Sample frequency. How often should a new set of measurements be
taken?
• Analytical tool. How are the measurements evaluated? In this case, audio
alarms are installed to monitor characteristics thought to have high pro-
cess capability. Other characteristics are monitored via control charts to
detect process trends leading to undesirable conditions.
TAble T.4 Example Control Plan
Characteristic Specification Measurement Sample Sample Analytical Reaction Rules
Technique Size Frequency Tool
Finished 1.250 ± Johannson 5 1 If other character-
diameter 0.0002 in subgroup/h X chart istics in control,
with run adjust
rules
Local 70 ± 5ºF Thermo- 1 Continuous Alarmed Stop production;
ambient couple adjust cooling
temperature control; resume
production once
temperature is
okay
Cooling 120 ± 5ºF Thermo- 1 1 sample/ Alarmed Stop production;
temperature couple minute adjust cooling
control; resume
production once
temperature is
okay
Coolant 0.88–0.94 Viscometer 1 1 sample/ Purge system
viscosity month X chart