
Page 239 - Six Sigma Demystified
P. 239
Part 3 s i x s i g m a to o l s 219
Figure F.6 First-order response surface with interaction using Minitab.
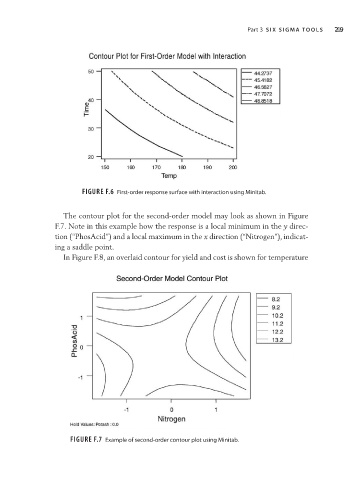
The contour plot for the second-order model may look as shown in Figure
F.7. Note in this example how the response is a local minimum in the y direc-
tion (“PhosAcid”) and a local maximum in the x direction (“Nitrogen”), indicat-
ing a saddle point.
In Figure F.8, an overlaid contour for yield and cost is shown for temperature
Figure F.7 Example of second-order contour plot using Minitab.