
Page 240 - Six Sigma Demystified
P. 240
220 Six SigMa DemystifieD
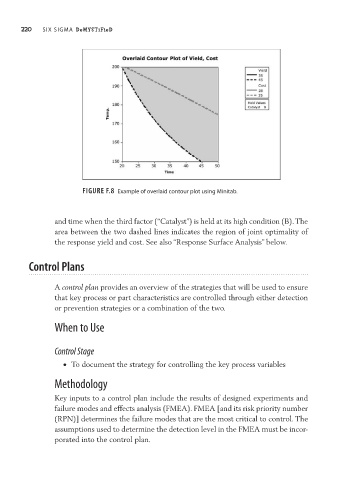
Figure F.8 Example of overlaid contour plot using Minitab.
and time when the third factor (“Catalyst”) is held at its high condition (B). The
area between the two dashed lines indicates the region of joint optimality of
the response yield and cost. See also “Response Surface Analysis” below.
Control Plans
A control plan provides an overview of the strategies that will be used to ensure
that key process or part characteristics are controlled through either detection
or prevention strategies or a combination of the two.
When to Use
Control Stage
• To document the strategy for controlling the key process variables
Methodology
Key inputs to a control plan include the results of designed experiments and
failure modes and effects analysis (FMEA). FMEA [and its risk priority number
(RPN)] determines the failure modes that are the most critical to control. The
assumptions used to determine the detection level in the FMEA must be incor-
porated into the control plan.