
Page 23 - Six Sigma Demystified
P. 23
4 Six SigMa DemystifieD
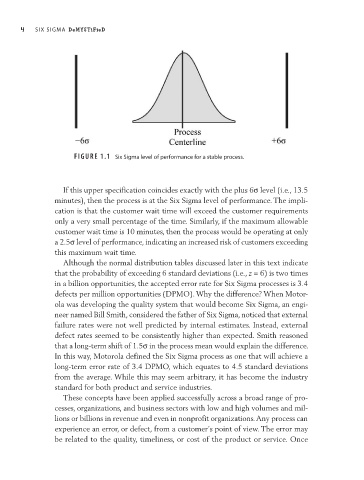
FIGURE 1.1 Six Sigma level of performance for a stable process.
If this upper specification coincides exactly with the plus 6s level (i.e., 13.5
minutes), then the process is at the Six Sigma level of performance. The impli-
cation is that the customer wait time will exceed the customer requirements
only a very small percentage of the time. Similarly, if the maximum allowable
customer wait time is 10 minutes, then the process would be operating at only
a 2.5s level of performance, indicating an increased risk of customers exceeding
this maximum wait time.
Although the normal distribution tables discussed later in this text indicate
that the probability of exceeding 6 standard deviations (i.e., z = 6) is two times
in a billion opportunities, the accepted error rate for Six Sigma processes is 3.4
defects per million opportunities (DPMO). Why the difference? When Motor-
ola was developing the quality system that would become Six Sigma, an engi-
neer named Bill Smith, considered the father of Six Sigma, noticed that external
failure rates were not well predicted by internal estimates. Instead, external
defect rates seemed to be consistently higher than expected. Smith reasoned
l
that a ong- term shift of 1.5s in the process mean would explain the difference.
In this way, Motorola defined the Six Sigma process as one that will achieve a
long- term error rate of 3.4 DPMO, which equates to 4.5 standard deviations
from the average. While this may seem arbitrary, it has become the industry
standard for both product and service industries.
These concepts have been applied successfully across a broad range of pro-
cesses, organizations, and business sectors with low and high volumes and mil-
lions or billions in revenue and even in nonprofit organizations. Any process can
experience an error, or defect, from a customer’s point of view. The error may
be related to the quality, timeliness, or cost of the product or service. Once