
Page 24 - Six Sigma Demystified
P. 24
Chapter 1 d e p loy m e n t s t r at e g y 5
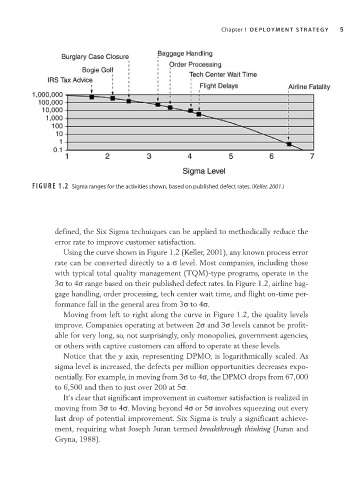
FIGURE 1.2 Sigma ranges for the activities shown, based on published defect rates. (Keller, 2001.)
defined, the Six Sigma techniques can be applied to methodically reduce the
error rate to improve customer satisfaction.
Using the curve shown in Figure 1.2 (Keller, 2001), any known process error
rate can be converted directly to a s level. Most companies, including those
with typical total quality management (TQM)-type programs, operate in the
3s to 4s range based on their published defect rates. In Figure 1.2, airline bag-
gage handling, order processing, tech center wait time, and flight on- time per-
formance fall in the general area from 3s to 4s.
Moving from left to right along the curve in Figure 1.2, the quality levels
improve. Companies operating at between 2s and 3s levels cannot be profit-
able for very long, so, not surprisingly, only monopolies, government agencies,
or others with captive customers can afford to operate at these levels.
Notice that the y axis, representing DPMO, is logarithmically scaled. As
sigma level is increased, the defects per million opportunities decreases expo-
nentially. For example, in moving from 3s to 4s, the DPMO drops from 67,000
to 6,500 and then to just over 200 at 5s.
It’s clear that significant improvement in customer satisfaction is realized in
moving from 3s to 4s. Moving beyond 4s or 5s involves squeezing out every
last drop of potential improvement. Six Sigma is truly a significant achieve-
ment, requiring what Joseph Juran termed breakthrough thinking (Juran and
Gryna, 1988).