
Page 25 - Six Sigma Demystified
P. 25
6 Six SigMa DemystifieD
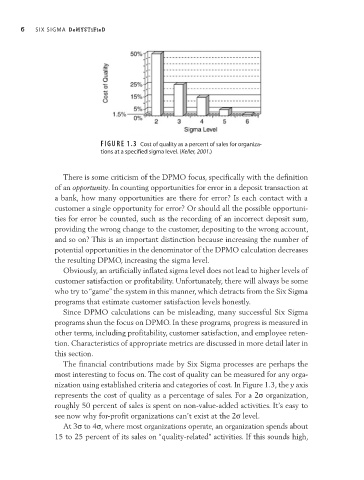
FIGURE 1.3 Cost of quality as a percent of sales for organiza-
tions at a specified sigma level. (Keller, 2001.)
There is some criticism of the DPMO focus, specifically with the definition
of an opportunity. In counting opportunities for error in a deposit transaction at
a bank, how many opportunities are there for error? Is each contact with a
customer a single opportunity for error? Or should all the possible opportuni-
ties for error be counted, such as the recording of an incorrect deposit sum,
providing the wrong change to the customer, depositing to the wrong account,
and so on? This is an important distinction because increasing the number of
potential opportunities in the denominator of the DPMO calculation decreases
the resulting DPMO, increasing the sigma level.
Obviously, an artificially inflated sigma level does not lead to higher levels of
customer satisfaction or profitability. Unfortunately, there will always be some
who try to “game” the system in this manner, which detracts from the Six Sigma
programs that estimate customer satisfaction levels honestly.
Since DPMO calculations can be misleading, many successful Six Sigma
programs shun the focus on DPMO. In these programs, progress is measured in
other terms, including profitability, customer satisfaction, and employee reten-
tion. Characteristics of appropriate metrics are discussed in more detail later in
this section.
The financial contributions made by Six Sigma processes are perhaps the
most interesting to focus on. The cost of quality can be measured for any orga-
nization using established criteria and categories of cost. In Figure 1.3, the y axis
represents the cost of quality as a percentage of sales. For a 2s organization,
roughly 50 percent of sales is spent on non- value- added activities. It’s easy to
see now why for- profit organizations can’t exist at the 2s level.
At 3s to 4s, where most organizations operate, an organization spends about
15 to 25 percent of its sales on “quality- related” activities. If this sounds high,