
Page 298 - Six Sigma Demystified
P. 298
mYsTiFieD / Romero & Kemp / 000-0 / Chapter 3
278 six sigma DemystifieD
standardized statistic at the stated significance, indicating whether the
null hypothesis is probable given the data. Software now makes it easy to
calculate the specific percentile corresponding to the calculated test sta-
tistic (see “Interpretation” below). p Values are more useful because we
might otherwise fail to reject a null hypothesis when the test statistic is
just inside the critical value or, conversely, reject a null hypothesis when
we are just beyond the critical value. Using the p value allows flexibility
in rejecting the test and input that might lead to collecting more data.
4. Collect samples; calculate statistics. The sample statistics and associated test
statistic for the particular null and alternative hypotheses are calculated
as described below. The sample size determines the type 2 error (β error):
the probability of accepting a false hypothesis. The value 1 – β is the
power of the test, as discussed in Chapter 6.
5. Reach conclusion. See “Interpretation” below.
The calculated test statistics for a variety of typical hypothesis tests are pro-
vided as follows:
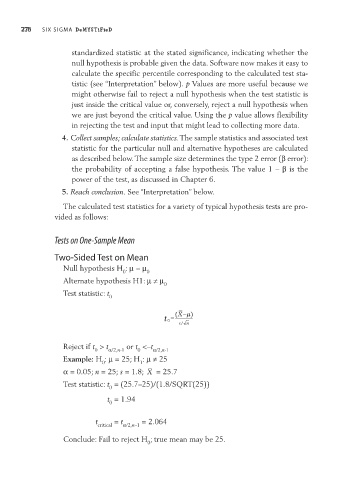
Tests on One-Sample Mean
Two-sided Test on mean
Null hypothesis H : m = m 0
0
Alternate hypothesis H1: m ≠ m
0
Test statistic: t 0
µ
0 t = ( X− )
n
s /
Reject if t > t or t <–t
0 α/2,n-1 0 α/2,n-1
Example: H : m = 25; H : m ≠ 25
1
0
α = 0.05; n = 25; s = 1.8; X = 25.7
Test statistic: t = (25.7–25)/(1.8/SQRT(25))
0
t = 1.94
0
t = t = 2.064
critical α/2,n–1
Conclude: Fail to reject H ; true mean may be 25.
0