
Page 295 - Six Sigma Demystified
P. 295
Part 3 s i x s i g m a to o l s 275
histogram when you have much fewer data. Bear in mind that fewer data gener-
ally imply a greater risk of error.
One problem that novice practitioners tend to overlook is that the histogram
provides only part of the picture. A histogram with a given shape may be pro-
duced by many different processes, the only difference in the data being their
order. So the histogram that looks like it fits our needs could have come from
data showing random variation about the average or from data that are clearly
trending toward an undesirable condition. Since the histogram does not con-
sider the sequence of the points, we lack this information. Statistical process
control (SPC) provides this context.
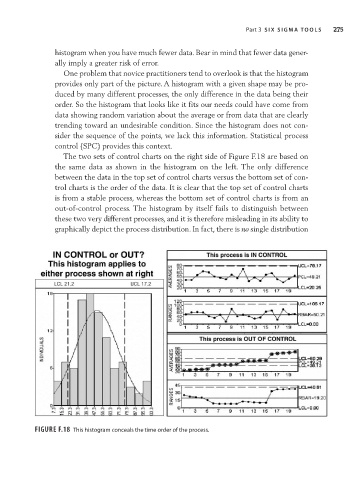
The two sets of control charts on the right side of Figure F.18 are based on
the same data as shown in the histogram on the left. The only difference
between the data in the top set of control charts versus the bottom set of con-
trol charts is the order of the data. It is clear that the top set of control charts
is from a stable process, whereas the bottom set of control charts is from an
out-of-control process. The histogram by itself fails to distinguish between
these two very different processes, and it is therefore misleading in its ability to
graphically depict the process distribution. In fact, there is no single distribution
Figure F.18 This histogram conceals the time order of the process.