
Page 292 - Six Sigma Demystified
P. 292
272 Six SigMa DemystifieD
Methodology
Rank order the data from the smallest value to the largest value. Calculate the
number of bars (or cells) as approximately equal to the square root of the num-
ber of data values. The number of cells (or bars) will influence the shape of the
perceived distribution, so never base it on convenience, data resolution, or any-
thing other than the number of data observations.
The width of each bar is calculated by dividing the range of the data (the
maximum value minus the minimum value) by the number of bars. Count
the number of data observations in each bar. The vertical axis plots the count
of observations in each bar. The horizontal axis displays the data values for
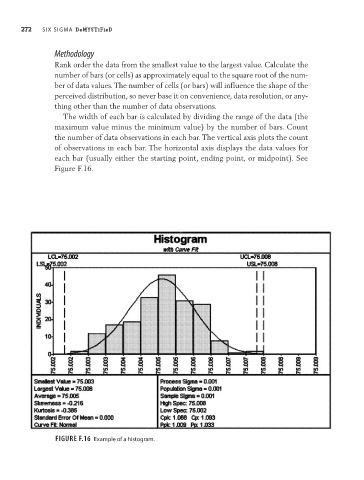
each bar (usually either the starting point, ending point, or midpoint). See
Figure F.16.
Figure F.16 Example of a histogram.