
Page 294 - Six Sigma Demystified
P. 294
274 Six SigMa DemystifieD
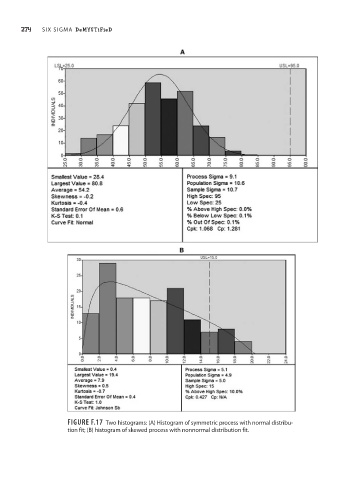
Figure F.17 Two histograms: (a) Histogram of symmetric process with normal distribu-
tion fit; (B) histogram of skewed process with nonnormal distribution fit.