Page 310 - Six Sigma Demystified
P. 310
290        Six SigMa  DemystifieD


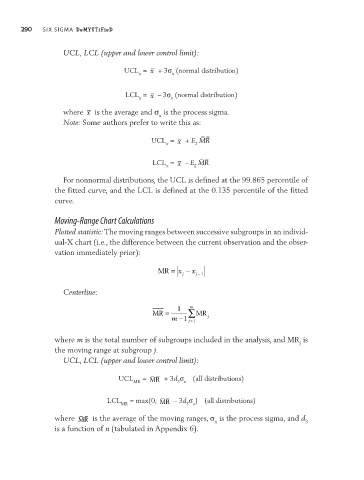
                          UCL, LCL (upper and lower control limit):

                                           UCL  =  x  + 3σ  (normal distribution)
                                               x         x

                                            LCL  =  x 	–	3σ  (normal distribution)
                                               x        x
                          where  x  is the average and σ  is the process sigma.
                                                     x
                          Note: Some authors prefer to write this as:

                                                   UCL  =  x  + E MR
                                                               2
                                                       x
                                                   LCL  =  x 	–	E MR
                                                       x
                                                               2
                          For nonnormal distributions, the UCL is defined at the 99.865 percentile of
                        the fitted curve, and the LCL is defined at the 0.135 percentile of the fitted
                        curve.

                        Moving-Range Chart Calculations
                        Plotted statistic: The moving ranges between successive subgroups in an individ-
                        ual-X chart (i.e., the difference between the current observation and the obser-
                        vation immediately prior):


                                                     MR = x  − x
                                                            j  j  −1
                          Centerline:

                                                          1   m
                                                   MR =      ∑ MR  j
                                                         m  − 1 j =1


                        where m is the total number of subgroups included in the analysis, and MR  is
                                                                                            j
                        the moving range at subgroup j.
                          UCL, LCL (upper and lower control limit):

                                          UCL MR  =  MR  + 3d σ   (all distributions)
                                                          3 x

                                      LCL MR  = max(0,  MR 	–	3d σ )  (all distributions)
                                                             3 x
                        where  MR  is the average of the moving ranges, σ  is the process sigma, and d
                                                                     x                        3
                        is a function of n (tabulated in Appendix 6).

