
Page 313 - Six Sigma Demystified
P. 313
Part 3 s i x s i g m a to o l s 293
When to Use
Analyze Stage and Improve Stage
• In analyzing the results of multiple regression and designed experiments
to graphically show the effect of two factor interaction on a response
Methodology
The plot variable is assigned to the x axis, and a second variable (usually the
response) is assigned to the y axis. The levels of the interaction variable are used
to form the separate lines displayed on the plot.
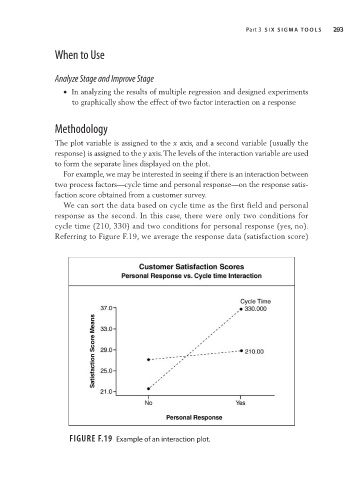
For example, we may be interested in seeing if there is an interaction between
two process factors—cycle time and personal response—on the response satis-
faction score obtained from a customer survey.
We can sort the data based on cycle time as the first field and personal
response as the second. In this case, there were only two conditions for
cycle time (210, 330) and two conditions for personal response (yes, no).
Referring to Figure F.19, we average the response data (satisfaction score)
Figure F.19 Example of an interaction plot.