
Page 321 - Six Sigma Demystified
P. 321
Part 3 S i x S i g m a To o l S 301
known that two things were related but never thought about the nature of the
cause and effect. Some software allows these arrows to be weighted (using
boldface) to show the relative strength of the relationship.
Numerical System
Analogous to the directional system, this system is intended to show the
strength and direction of relationships. For example, a 10 implies a strong causal
relationship, whereas 1/10 shows a strong relationship in the other direction.
Matrix Diagram
Excel
Using Green Belt XL Add-On
Use New Chart\Matrix Diagram. Enter the numerical score for each paired
relationship.
Interpretation
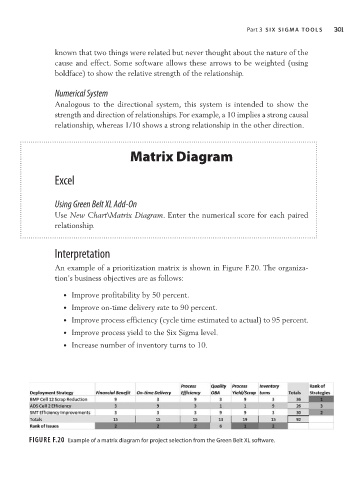
An example of a prioritization matrix is shown in Figure F.20. The organiza-
tion’s business objectives are as follows:
• Improve profitability by 50 percent.
• Improve on-time delivery rate to 90 percent.
• Improve process efficiency (cycle time estimated to actual) to 95 percent.
• Improve process yield to the Six Sigma level.
• Increase number of inventory turns to 10.
Figure F.20 Example of a matrix diagram for project selection from the green Belt xL software.