
Page 323 - Six Sigma Demystified
P. 323
Part 3 S i x S i g m a To o l S 303
Methodology
First, decide how data will be collected for the analysis. Are multiple measure-
ments from the same sample available (or useful) to calculate within-sample
variation?
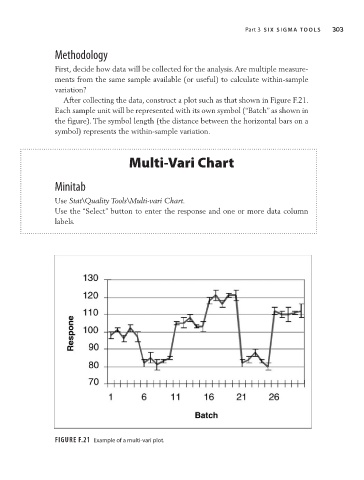
After collecting the data, construct a plot such as that shown in Figure F.21.
Each sample unit will be represented with its own symbol (“Batch” as shown in
the figure). The symbol length (the distance between the horizontal bars on a
symbol) represents the within-sample variation.
Multi-Vari Chart
Minitab
Use Stat\Quality Tools\Multi-vari Chart.
Use the “Select” button to enter the response and one or more data column
labels.
Figure F.21 Example of a multi-vari plot.