Page 328 - Six Sigma Demystified
P. 328
308        Six SigMa  DemystifieD

                        Methodology

                        Samples are collected from the process at specific points each time. Each sam-
                        ple (at each point in time) has the same number of units, each of which must
                        either match or not match some criterion of interest (such as being defective).
                          Plotted statistic: The number of items in the sample meeting a criterion of
                        interest.
                          Centerline:
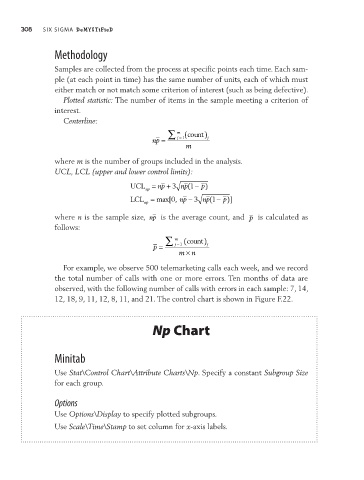
                                                       ∑  m  (count )
                                                   np =   j =1    j
                                                            m
                        where m is the number of groups included in the analysis.
                        UCL, LCL (upper and lower control limits):

                                             UCL =   np + 3  np 1 −  p)
                                                             (
                                                 np
                                             LCL =  max[0,  np − 3  np 1 −  p)]
                                                                   (
                                                 np
                        where n is the sample size,  np  is the average count, and  p  is calculated as
                        follows:
                                                       ∑  m  (count )
                                                   p =   j =1     j
                                                             ×
                                                           m n
                          For example, we observe 500 telemarketing calls each week, and we record
                        the total number of calls with one or more errors. Ten months of data are
                        observed, with the following number of calls with errors in each sample: 7, 14,
                        12, 18, 9, 11, 12, 8, 11, and 21. The control chart is shown in Figure F.22.


                                                   Np Chart


                        Minitab


                        Use Stat\Control Chart\Attribute Charts\Np. Specify a constant Subgroup Size
                        for each group.

                        Options

                        Use Options\Display to specify plotted subgroups.
                        Use Scale\Time\Stamp to set column for x-axis labels.

