
Page 332 - Six Sigma Demystified
P. 332
312 Six SigMa DemystifieD
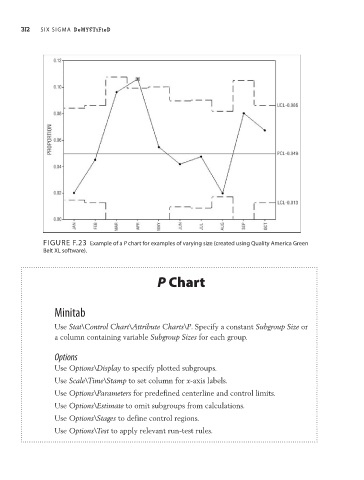
FiguRE F.23 Example of a P chart for examples of varying size (created using Quality america green
Belt xL software).
P Chart
Minitab
Use Stat\Control Chart\Attribute Charts\P. Specify a constant Subgroup Size or
a column containing variable Subgroup Sizes for each group.
Options
Use Options\Display to specify plotted subgroups.
Use Scale\Time\Stamp to set column for x-axis labels.
Use Options\Parameters for predefined centerline and control limits.
Use Options\Estimate to omit subgroups from calculations.
Use Options\Stages to define control regions.
Use Options\Test to apply relevant run-test rules.