
Page 329 - Six Sigma Demystified
P. 329
Part 3 S i x S i g m a To o l S 309
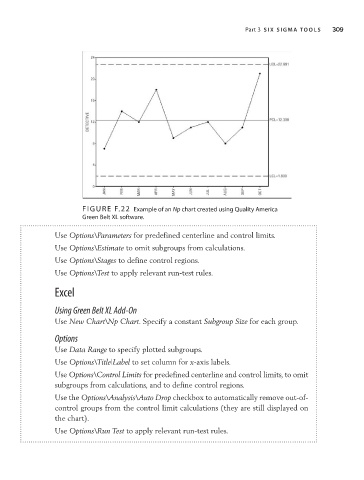
FiguRE F.22 Example of an Np chart created using Quality america
green Belt xL software.
Use Options\Parameters for predefined centerline and control limits.
Use Options\Estimate to omit subgroups from calculations.
Use Options\Stages to define control regions.
Use Options\Test to apply relevant run-test rules.
Excel
Using Green Belt XL Add-On
Use New Chart\Np Chart. Specify a constant Subgroup Size for each group.
Options
Use Data Range to specify plotted subgroups.
Use Options\Title|Label to set column for x-axis labels.
Use Options\Control Limits for predefined centerline and control limits, to omit
subgroups from calculations, and to define control regions.
Use the Options\Analysis\Auto Drop checkbox to automatically remove out-of-
control groups from the control limit calculations (they are still displayed on
the chart).
Use Options\Run Test to apply relevant run-test rules.