
Page 333 - Six Sigma Demystified
P. 333
Part 3 S i x S i g m a To o l S 313
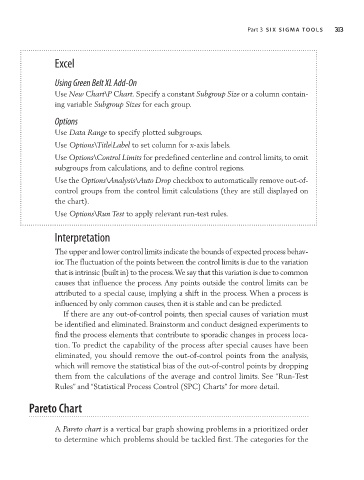
Excel
Using Green Belt XL Add-On
Use New Chart\P Chart. Specify a constant Subgroup Size or a column contain-
ing variable Subgroup Sizes for each group.
Options
Use Data Range to specify plotted subgroups.
Use Options\Title|Label to set column for x-axis labels.
Use Options\Control Limits for predefined centerline and control limits, to omit
subgroups from calculations, and to define control regions.
Use the Options\Analysis\Auto Drop checkbox to automatically remove out-of-
control groups from the control limit calculations (they are still displayed on
the chart).
Use Options\Run Test to apply relevant run-test rules.
Interpretation
The upper and lower control limits indicate the bounds of expected process behav-
ior. The fluctuation of the points between the control limits is due to the variation
that is intrinsic (built in) to the process. We say that this variation is due to common
causes that influence the process. Any points outside the control limits can be
attributed to a special cause, implying a shift in the process. When a process is
influenced by only common causes, then it is stable and can be predicted.
If there are any out-of-control points, then special causes of variation must
be identified and eliminated. Brainstorm and conduct designed experiments to
find the process elements that contribute to sporadic changes in process loca-
tion. To predict the capability of the process after special causes have been
eliminated, you should remove the out-of-control points from the analysis,
which will remove the statistical bias of the out-of-control points by dropping
them from the calculations of the average and control limits. See “Run-Test
Rules” and “Statistical Process Control (SPC) Charts” for more detail.
Pareto Chart
A Pareto chart is a vertical bar graph showing problems in a prioritized order
to determine which problems should be tackled first. The categories for the