
Page 338 - Six Sigma Demystified
P. 338
318 Six SigMa DemystifieD
The estimated standard deviation for each activity is calculated as
σ = (b – a)/6
Based on central limit theorem, the total time for all tasks follows the normal
distribution. The total duration can be calculated by summing the task times
on the critical path. Likewise, the variance of the project duration can be cal-
culated by summing the variances for the task times on the critical path. Recall
that the variance is the standard deviation squared:
Total duration = sum(task times on critical path)
Variance (total duration) = sum(variances for task times on critical
path)
Standard deviation (total duration) = square root[variance(total
duration)]
Upper predicted limit of duration = total duration + 1.96 ×
standard deviation(total duration)
Lower predicted limit of duration = total duration – 1.96 ×
standard deviation(total duration)
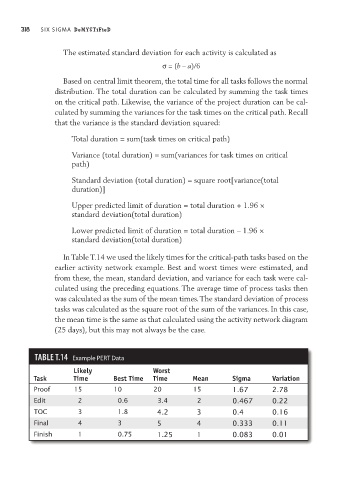
In Table T.14 we used the likely times for the critical-path tasks based on the
earlier activity network example. Best and worst times were estimated, and
from these, the mean, standard deviation, and variance for each task were cal-
culated using the preceding equations. The average time of process tasks then
was calculated as the sum of the mean times. The standard deviation of process
tasks was calculated as the square root of the sum of the variances. In this case,
the mean time is the same as that calculated using the activity network diagram
(25 days), but this may not always be the case.
TAbLe T.14 Example PERT Data
Likely Worst
Task Time Best Time Time Mean Sigma Variation
Proof 15 10 20 15 1.67 2.78
Edit 2 0.6 3.4 2 0.467 0.22
TOC 3 1.8 4.2 3 0.4 0.16
Final 4 3 5 4 0.333 0.11
Finish 1 0.75 1.25 1 0.083 0.01