Page 363 - Six Sigma Demystified
P. 363

Part 3  S i x   S i g m a  To o l S        343


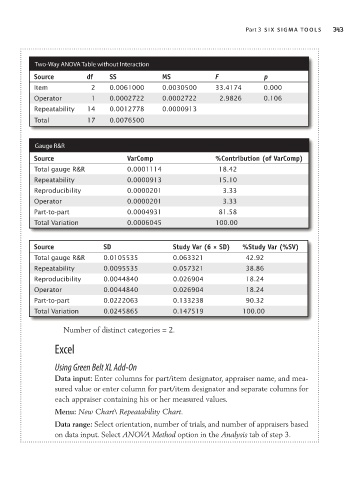
                     Two-Way aNOVa Table without interaction
                     Source         df    SS             MS            F             p
                     Item           	 2   	 0.0061000    	 0.0030500    	33.4174     	 0.000
                     Operator       	 1   	 0.0002722    	 0.0002722    	 2.9826     	 0.106
                     Repeatability  	14   	 0.0012778    	 0.0000913
                     Total          	17   	 0.0076500


                     gauge R&R
                     Source                    VarComp                  %Contribution (of VarComp)
                     Total	gauge	R&R           0.0001114                	 18.42
                     Repeatability             0.0000913                	 15.10
                     Reproducibility           0.0000201                	 3.33
                     Operator                  0.0000201                	 3.33
                     Part-to-part              0.0004931                	 81.58
                     Total	Variation           0.0006045                	 100.00


                     Source             SD                  Study Var (6 × SD)  %Study Var (%SV)
                     Total	gauge	R&R    0.0105535           0.063321           	 42.92
                     Repeatability      0.0095535           0.057321           	 38.86
                     Reproducibility    0.0044840           0.026904           	 18.24
                     Operator           0.0044840           0.026904           	 18.24
                     Part-to-part       0.0222063           0.133238           	 90.32
                     Total	Variation    0.0245865           0.147519           	 100.00

                             Number of distinct categories = 2.

                           Excel

                           Using Green Belt XL Add-On
                           Data input: Enter columns for part/item designator, appraiser name, and mea-
                           sured value or enter column for part/item designator and separate columns for
                           each appraiser containing his or her measured values.
                           Menu: New Chart\ Repeatability Chart.
                           Data range: Select orientation, number of trials, and number of appraisers based
                           on data input. Select ANOVA Method option in the Analysis tab of step 3.
   358   359   360   361   362   363   364   365   366   367   368