
Page 358 - Six Sigma Demystified
P. 358
338 Six SigMa DemystifieD
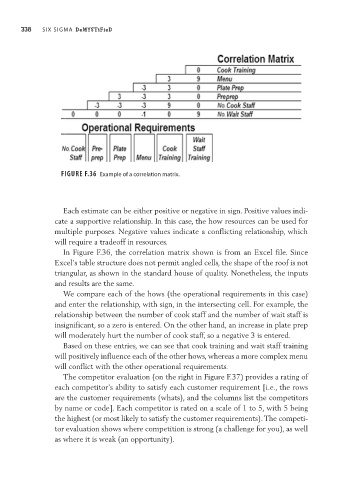
Figure F.36 Example of a correlation matrix.
Each estimate can be either positive or negative in sign. Positive values indi-
cate a supportive relationship. In this case, the how resources can be used for
multiple purposes. Negative values indicate a conflicting relationship, which
will require a tradeoff in resources.
In Figure F.36, the correlation matrix shown is from an Excel file. Since
Excel’s table structure does not permit angled cells, the shape of the roof is not
triangular, as shown in the standard house of quality. Nonetheless, the inputs
and results are the same.
We compare each of the hows (the operational requirements in this case)
and enter the relationship, with sign, in the intersecting cell. For example, the
relationship between the number of cook staff and the number of wait staff is
insignificant, so a zero is entered. On the other hand, an increase in plate prep
will moderately hurt the number of cook staff, so a negative 3 is entered.
Based on these entries, we can see that cook training and wait staff training
will positively influence each of the other hows, whereas a more complex menu
will conflict with the other operational requirements.
The competitor evaluation (on the right in Figure F.37) provides a rating of
each competitor’s ability to satisfy each customer requirement [i.e., the rows
are the customer requirements (whats), and the columns list the competitors
by name or code]. Each competitor is rated on a scale of 1 to 5, with 5 being
the highest (or most likely to satisfy the customer requirements). The competi-
tor evaluation shows where competition is strong (a challenge for you), as well
as where it is weak (an opportunity).