Page 353 - Six Sigma Demystified
P. 353

Part 3  S i x   S i g m a  To o l S        333


                           initial stages of product or process design,or in the measure stage we may have
                           processes that lack statistical control.
                             The statistic P  can be used when there are both and upper and lower speci-
                                          p
                           fications for the sample. P  can be used when only one or the other or both
                                                   pk
                           specifications are provided.


                           Measure Stage
                             •	 To provide a process baseline estimate for an uncontrolled process


                           Methodology

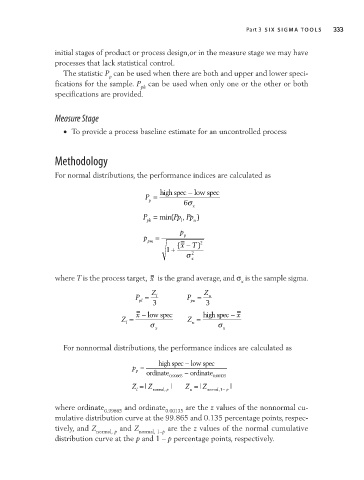
                           For normal distributions, the performance indices are calculated as


                                                    P =  high spec  − low spec
                                                     p         6σ
                                                                 x
                                                               ,
                                                   P = min( Pp Pp )
                                                    pk        l   u
                                                              p
                                                    p  =       p
                                                     pm      (x  − ) 2
                                                                 T
                                                           +
                                                          1+
                                                               σ 2
                                                                 x
                           where T is the process target,  x  is the grand average, and σ  is the sample sigma.
                                                                               x
                                                      Z             Z
                                                 P =   l        P =   u
                                                  pl             pu
                                                      3              3
                                             Z =  x − low spec  Z =  high spec  −  x
                                               l     σ x         u      σ x


                             For nonnormal distributions, the performance indices are calculated as

                                                        high spec  − low spec
                                                p =
                                                 p
                                                    ordinate   − ordinate
                                                                        0
                                                           .
                                                           0 99865     0.00135
                                                Z = |  Z normal , p  |  Z = |  Z normal , 1 p−  |
                                                                 u
                                                  l
                           where ordinate      and ordinate     are the z values of the nonnormal cu-
                                         0.99865          0.00135
                           mulative distribution curve at the 99.865 and 0.135 percentage points, respec-
                           tively, and Z     and Z         are the z values of the normal cumulative
                                      normal, p   normal, 1–p
                           distribution curve at the p and 1 – p percentage points, respectively.
   348   349   350   351   352   353   354   355   356   357   358