
Page 357 - Six Sigma Demystified
P. 357
Part 3 S i x S i g m a To o l S 337
to each what, recording the score in the proper intersecting cell using the fol-
lowing scoring index:
Strong relationship = 9.
Moderate relationship = 3.
Weak relationship = 1.
No relationship = 0.
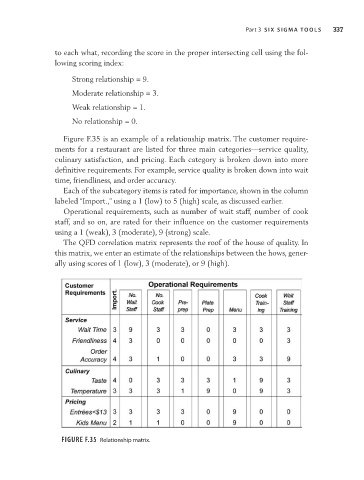
Figure F.35 is an example of a relationship matrix. The customer require-
ments for a restaurant are listed for three main categories—service quality,
culinary satisfaction, and pricing. Each category is broken down into more
definitive requirements. For example, service quality is broken down into wait
time, friendliness, and order accuracy.
Each of the subcategory items is rated for importance, shown in the column
labeled “Import.,” using a 1 (low) to 5 (high) scale, as discussed earlier.
Operational requirements, such as number of wait staff, number of cook
staff, and so on, are rated for their influence on the customer requirements
using a 1 (weak), 3 (moderate), 9 (strong) scale.
The QFD correlation matrix represents the roof of the house of quality. In
this matrix, we enter an estimate of the relationships between the hows, gener-
ally using scores of 1 (low), 3 (moderate), or 9 (high).
Figure F.35 Relationship matrix.