
Page 348 - Six Sigma Demystified
P. 348
328 Six SigMa DemystifieD
For example, if it takes 2 hours on average to complete each purchase order,
then there are 0.5 completions per hour. This is the denominator of the equa-
tion for Little’s law. If there are 10 purchase orders waiting in queue (the
numerator), then Little’s law says that we need 10 divided by 0.5 equals 20
hours of lead time for the process. In other words, we can’t process any new
orders until the 20-hour lead time has allowed the existing work-in-process to
be completed.
Interpretation
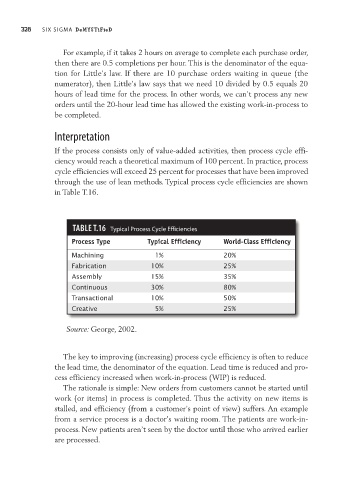
If the process consists only of value-added activities, then process cycle effi-
ciency would reach a theoretical maximum of 100 percent. In practice, process
cycle efficiencies will exceed 25 percent for processes that have been improved
through the use of lean methods. Typical process cycle efficiencies are shown
in Table T.16.
TAbLe T.16 Typical Process Cycle Efficiencies
Process Type Typical Efficiency World-Class Efficiency
Machining 1% 20%
Fabrication 10% 25%
Assembly 15% 35%
Continuous 30% 80%
Transactional 10% 50%
Creative 5% 25%
Source: George, 2002.
The key to improving (increasing) process cycle efficiency is often to reduce
the lead time, the denominator of the equation. Lead time is reduced and pro-
cess efficiency increased when work-in-process (WIP) is reduced.
The rationale is simple: New orders from customers cannot be started until
work (or items) in process is completed. Thus the activity on new items is
stalled, and efficiency (from a customer’s point of view) suffers. An example
from a service process is a doctor’s waiting room. The patients are work-in-
process. New patients aren’t seen by the doctor until those who arrived earlier
are processed.