
Page 347 - Six Sigma Demystified
P. 347
Part 3 S i x S i g m a To o l S 327
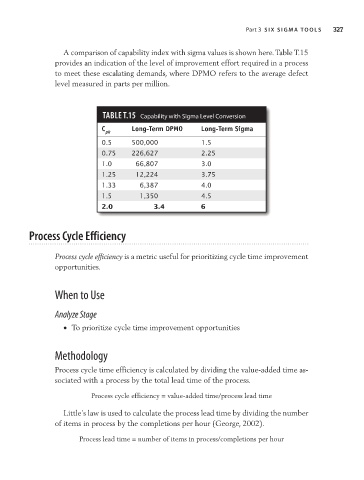
A comparison of capability index with sigma values is shown here. Table T.15
provides an indication of the level of improvement effort required in a process
to meet these escalating demands, where DPMO refers to the average defect
level measured in parts per million.
TAbLe T.15 Capability with Sigma Level Conversion
C pk Long-Term DPMO Long-Term Sigma
0.5 500,000 1.5
0.75 226,627 2.25
1.0 66,807 3.0
1.25 12,224 3.75
1.33 6,387 4.0
1.5 1,350 4.5
2.0 3.4 6
Process Cycle efficiency
Process cycle efficiency is a metric useful for prioritizing cycle time improvement
opportunities.
When to Use
Analyze Stage
• To prioritize cycle time improvement opportunities
Methodology
Process cycle time efficiency is calculated by dividing the value-added time as-
sociated with a process by the total lead time of the process.
Process cycle efficiency = value-added time/process lead time
Little’s law is used to calculate the process lead time by dividing the number
of items in process by the completions per hour (George, 2002).
Process lead time = number of items in process/completions per hour