
Page 349 - Six Sigma Demystified
P. 349
Part 3 S i x S i g m a To o l S 329
Process Decision Program Charts
Process decision program charts (PDPCs) are used to delineate the required steps
to complete a process, anticipate any problems that might arise in the steps, and
map out a way of counteracting those problems.
When to Use
Analyze Stage
• To understand root causes of problems
Improve Stage
• To identify potential problems with the suggested solution so that contin-
gency plans may be adopted for process control
Methodology
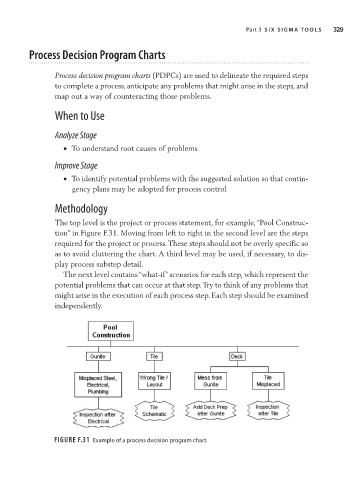
The top level is the project or process statement, for example, “Pool Construc-
tion” in Figure F.31. Moving from left to right in the second level are the steps
required for the project or process. These steps should not be overly specific so
as to avoid cluttering the chart. A third level may be used, if necessary, to dis-
play process substep detail.
The next level contains “what-if” scenarios for each step, which represent the
potential problems that can occur at that step. Try to think of any problems that
might arise in the execution of each process step. Each step should be examined
independently.
Figure F.31 Example of a process decision program chart.